|
Different uses for voting
need different types of voting. |
 |
Fair-Share Ballots II |
 |

|
This page follows the workshop using tabletop voting,
and the demonstration of basic Movable Money Votes (MMV or MMVb). Parenthetical comments are for math-savvy audiences. Bracketed comments are for the teacher only. Advanced-Ballot CalculationThe ballot and tally for basic MMV were simpler than these partly because these ballots let supporters adjust a project's budget on the same ballot while they set its priority.My ballot can offer money to each of my top choices by calculations that depend on whether I choose to rank, grade or score the projects. If I score my "joy in project B" at 200 and another project of equal cost at 100, the ballot gives twice as many votes to project B. If I rank or grade the projects, I may choose a line such as this one and make the vote for an item its average height under this line.
|
 |
|
|
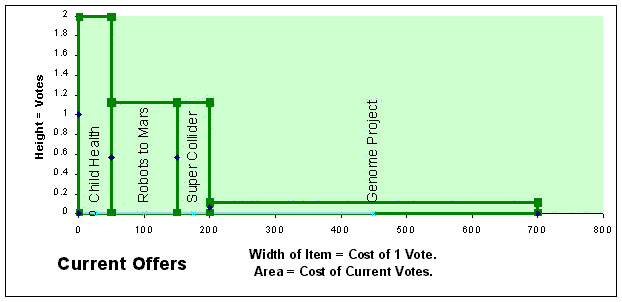
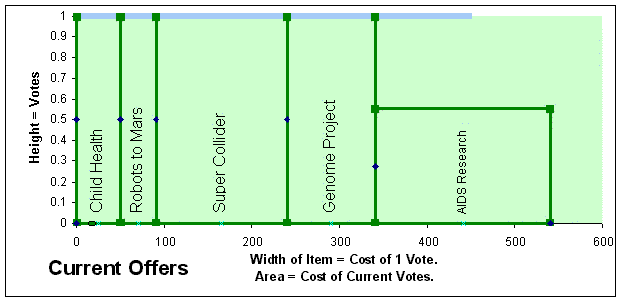
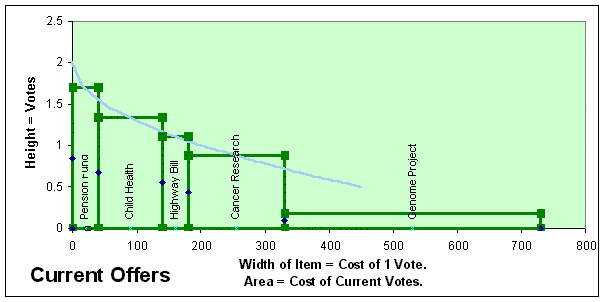
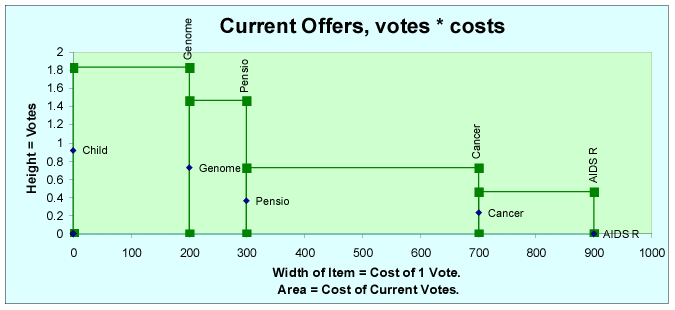
( This option automatically gives more than one vote to my first dollar of suggested budgets [Point to the first dollar of the first choice.] and less than one to my share's last dollar of suggested budgets. [Point to the last dollar of the last choice.] Each of my favorite's automatically gets a vote in between this maximum and this minimum. So the average dollar of these suggested budgets gets one vote.) Charts of OffersWhat shape should a voter's funding curve be: flat or steep, straight, concave, convex or jagged? . . .The charts below were made by an Excel ballot for advanced Movable Money Votes. Each chart graphs one ballot's current "offers". The voter's favorite items each have a box on his graph. A box's height shows the number of votes for that item. A box's width shows the cost of 1 offer (and 1 vote). So the area in a box shows how much money the ballot currently offers the item; that is the item's number of votes times its cost for each vote. Graph 1: The ballot below is offering one vote each to as many items as it can afford. The line starts at 1 vote, where it intercepts the vertical Y axis. The angle or slope of the line is 0 times X.
Often a ballot runs out of money in the middle of an item, so it gives that item a "partial vote". This ballot can afford only a partial vote for Aids Research. |
|
|
|
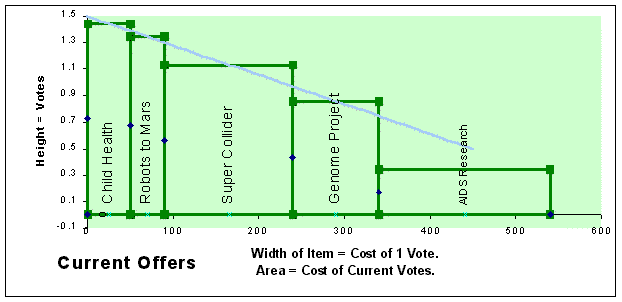
Graph 2: This next ballot helps the favorite item more than the second or third choice. But it has no more spending power than the ballot above because both give a total of 1 vote to 1 share of money. The area under both lines is the same. All five of these graphs have an area equal to 1 vote (on the Y axis) times 1 share of money (on the X axis.) straight line = (-1 × X) + 1.5 |
|
|
|
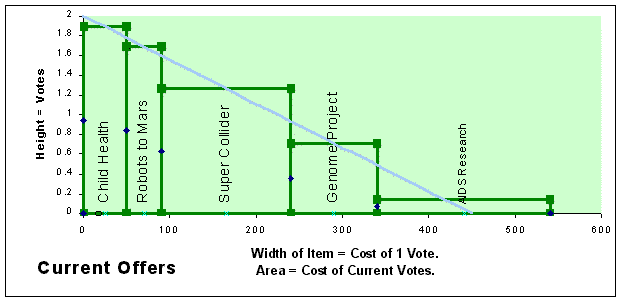
Graph 3: The ballot below helps the favorite item more than the second favorite. It gives little help to the last item on the right. straight line = (-2 × X) + 2
|
|
|
|
Graph 4: The funding curve below gives almost 2 votes to the first choice yet still tries to give a half vote to the last choice within 1 share ($475.). In this case the last item is too costly, so it gets only a partial vote. curved line = (-1.5 × X ^ (1/2) ) + 2 |
|
|
|
A voter may score items instead of grading or ranking them. His scores tell the tally "I like B twice as much as C." Such ratios let the tally construct his personal "utility curve". The tally uses his curve to apportion his share of funding. It does not compare or aggregate his scores with scores from other voters. Graph 5:: voter's funding defined by scores |
|
Rewarding Sincere ScoresExaggeration is normally the strongest way to help your highest choice, while neglecting your middle choices. Scored ballots could induce a wily rep to use exaggeration with a black-and- white strategy, as illustrated below.The funding graph on the left has a heavy black box representing money for one or two favorites and an empty white space for all other preferences. Contrast that with the graph on the right, a gradient from black to white under a curve. |

|
|

|
|
Now which requires and allows more subtle distinctions: A) tossing each project into either a black bin labeled "Maximum Vote" or a white bin labeled "Zero". OR B) lining up projects from left to right with your favorite first and your least favorite far to the right?
So scoring might give a rep only a false and temporary sense of freedom of expression. Her choice might not be any score between 0 and 2 votes; it might be just two scores, either 0 or 2 votes. (Graded and ranked ballots use pre-defined curves, like the one on the right, to create more self-expression.) Here are three forms of the black-and- white strategy and ways to prevent them.
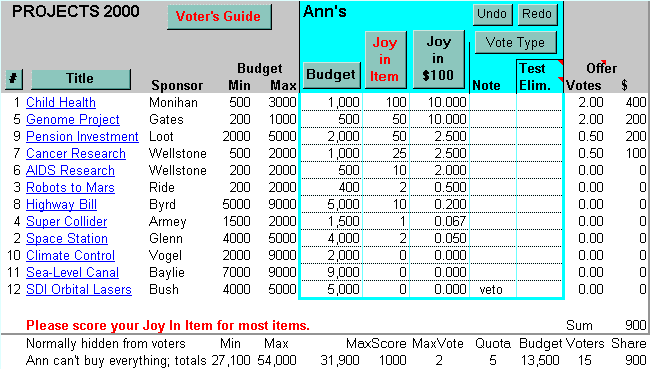
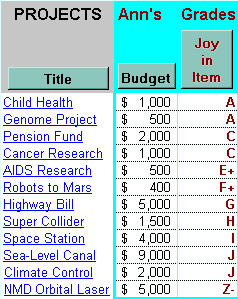
The ballot below prevents these strategies and so encourages sincere ballots to give voters equal power and to find common goods. Try a BallotThe picture below shows a ballot for fair-share spending. Clicking the picture downloads the ballot, written in Microsoft Excel.The simplest way to vote is by putting projects in categories which say, "These are grade A projects; these are grade C and those are grade Z." The most precise way to vote is to give scores which say, "This one is worth 1.25 times as much as that one." This ballot allows voters to switch between simplicity and precision. A voter rates her joy in each item. The ballot offers money first to the most cost-effective items, those with the highest "Joy in $100". When a voter rates a "Joy in Item" the ballot calculates her "Joy in $100" (or vice versa). It then apportions her money among her favorite items and these offers appear in the right- hand columns. If one of her favorites is eliminated (by a mark under "Test Elim.") the ballot automatically transfers that money to lower choices. |
| This voter rated Cancer Research only one- quarter as cost- effective as Child Health under "Joy in $100", so Cancer Research gets only one- quarter as many votes as Health, which gets two votes. Each vote for Child Health costs her: her preferred budget of $1000 / 5 vote quota = $200. So the two votes for Health cost her two times $200, that is $400. | She gave Cancer Research the same preferred budget, so 1 vote for it would cost her the same as 1 vote for Child Health. A half vote for Cancer Research costs 0.5 times $200 = $100. All of her money has been offered to remaining favorites in proportion to her "Joy in $100" and her budgets for them. |
|
Learning by doing is best. Play with the numbers on an MMVa ballot in MS Excel.
Or try a simple spending ballot in Open Office.
Or view a fair-share ballot online after you sign in at Google spreadsheets.
You can download software for tallies too.
The next page adds more detail about the tally steps and how a ballot apportions money, labor or other resources among a voter's top-rated items. |

|
|




 Accurate Democracy


